Looker Studio: Turning Data into Insightful Reports and Dashboards
In today’s data-driven world, businesses rely on actionable insights to make informed decisions. Looker Studio, a powerful web-based tool, empowers users to transform raw data into compelling visualizations, interactive reports, and dashboards. Whether you’re a data analyst, marketer, or business leader, Looker Studio provides the means to unlock the potential of your data.
What Is Looker Studio?
Looker Studio is a free platform that bridges the gap between data and decision-making. Here’s what you need to know:
- Data Connection Made Easy: Looker Studio offers built-in and partner connectors, allowing you to access a wide variety of data sources. Whether it’s your CRM system, marketing analytics, or financial data, Looker Studio makes it possible to connect to virtually any kind of data.
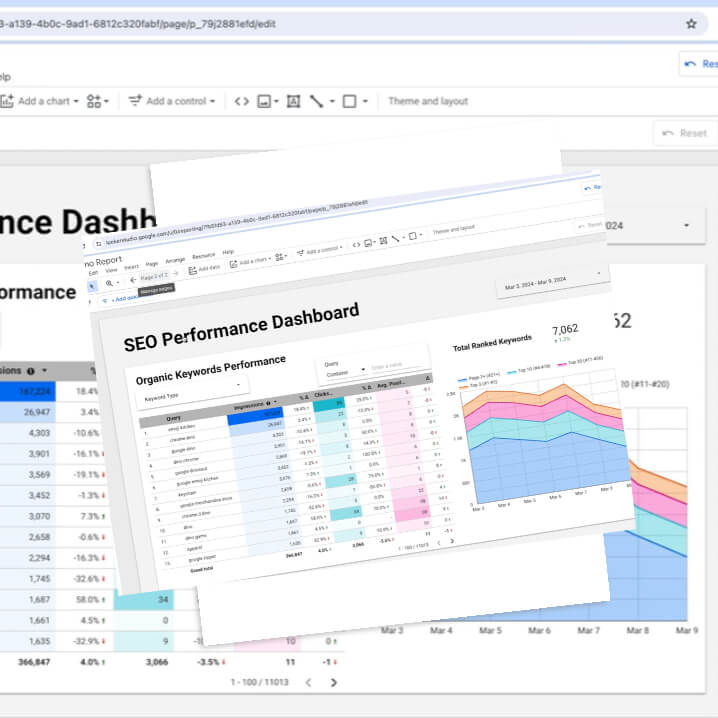
- Visualize Your Insights: Turn your data into compelling stories of data visualization art. With Looker Studio’s web-based reporting tools, you can quickly build interactive reports and dashboards. Whether you’re creating line charts, bar graphs, geo maps, or paginated data tables, Looker Studio provides the flexibility to visualize your data in meaningful ways.
- Collaborate and Share: Looker Studio isn’t just about creating reports; it’s about sharing knowledge. Collaborate with colleagues in real time, share your insights with teams, and even embed your reports on web pages. The gallery showcases what others have built, inspiring creativity and collaboration.
Getting Started with Looker Studio
- Sign In: Visit the Looker Studio website and sign in. If you’re new to Looker Studio, create an account—it’s easy and free.
- Connect to Data: Once you’re in, explore the data connectors. Looker Studio allows you to access over 1000 data sets. Whether it’s cloud-based data, spreadsheets, or databases, you’ll find the connections you need.
- Create Your Report: The drag-and-drop report editor is your canvas. Use it to tell your data story. Add charts, graphs, and tables. Customize colors, labels, and formatting. Looker Studio gives you the tools to create reports that resonate.
- Share Your Insights: Share your reports with colleagues, clients, or the world. Collaborate on findings, discuss trends, and make data-driven decisions together. And don’t forget to explore what others have built in the gallery for inspiration.
Looker Studio is more than a reporting tool; it’s a gateway to understanding your data. Whether you’re analyzing sales performance, tracking marketing campaigns, or monitoring user engagement, Looker Studio empowers you to turn data into actionable insights. So, sign in, connect, visualize, and share—your data has stories waiting to be told! We provide Our client SEO Service Report with Looker Studio